For my BTech Biotechnology honours degree in 2001 (from Auckland University) my research project was to probe the unknown diversity of bacterial genes to pick up novel and important enzymes. The technique I used was total extraction of 'metagenomic' DNA from activated sludge, followed by fragment insertion into an expression vector, and then functional assay of the resultant clones. This was oringinally written in 2001 as my Bachelor's degree honours project, I put this online as one of my first files, and recently made a few minor formatting corrections in 2010. The reference for this work is:
Weir, B.S., (2001) Bioprospecting Environmental Genomes, BTech Honours Thesis, The University of Auckland.
Abstract
Microorganisms dominate the biosphere, yet current methods of culture reveal less than 1% of the microbial diversity. This hidden diversity contains a vast array of novel enzymes and antimicrobials. New enzymes could potentially be useful to many industrial applications, and new antimicrobial drugs are becoming increasingly important. Techniques such as those detailed in this proposal, present one way of accessing or bioprospecting this hidden unculturable diversity. The essence behind these methods is to extract the DNA from a given environment (activated sludge was used here). Then insert a fragment of this DNA into an expression plasmid, creating a 'metagenomic' library. Then to functionally assay the expressed DNA for a multitude of activities (lipase, cellulase, protease, hemicellulase, and antimicrobial activities were planned). Insufficient time however, did not allow completion of this project. Problems were encountered with plasmid amplification and obtaining good quality high molecular weight DNA from the activated sludge samples. Solutions and suggestions for these problems are discussed.
Acknowledgements
I would like to thank my supervisors David Saul and Susan Turner for their support and guidance throughout the course of this project. Thank you to Cherida Trott, Kim-Ly Chhour, Shingo Miyauchi, and Andrew Gerrie who welcomed me into the lab and showed me the ropes, and answered my "So where is the …" and "How do you …" questions.
Introduction
There are more animals living in the scum on the teeth in a man's mouth than there are men in a whole kingdom
– Antony von Leeuwenhoek Scientists may be able to make any molecule that they imagine on a computer, but Mother Nature is an infinitely more ingenious and exciting chemist
– Edward Hammond Our world is dominated by that which cannot be seen with the naked eye. The prokaryotes out-number the eukaryotes in both biomass quantity and number of species. They represent a vast reservoir of diversity; unfortunately, much of this is currently inaccessible using classical microbiological methods. However through the application of novel techniques, this world is gradually being revealed.
Bioprospecting and the Metagenome
Bioprospecting has been defined as: The search for and sustainable commercialisation of valuable chemical compounds and genetic material found in plants, animals and microorganisms
– Parliment of Australia report: (http://www.aph.gov.au/house/committee/primind/bioinq/subs.htm/sub28e.pdf). Such compounds could potentially be used as new pharmaceuticals, bioactives, biocatalysts and biomaterials (Cowan 2000). Of the world's 25 top-selling pharmaceuticals, 10 were originally sourced from animals, plants or microorganisms. In 1995, these accounted for nearly $US14 billion in global sales (http://www.amonline.net.au/factsheets/bioprospecting.htm). Hence bioprospecting of environmental genomes provides great financial incentives as well as scientific interest. The term 'metagenome' was coined by Handelsman et al. (1998), as: "The genomes of the total microbiota found in nature." These organisms can include bacteria, archaea, fungi, protozoa, and algae, depending on the nature of the sample.
Diversity and the 'Unculturables'
Environmental samples are chosen for bioprospecting primarily due to the diversity of organisms within an environmental ecosystem. Figure 1 below shows the biodiversity class of different biofilms. On the lower end of the scale are monoculture bacterial colonies; such as those typically found on an agar plate in microbiology laboratories. But monocultures are rarely found in natural situations, with the notable exception of contamination on medical implants (Allison, et al. 2000). Even here the usual case is a few organisms, typically less than 10. Specialist communities such as those in wastewater treatment equipment and bioremediation, have greater diversity. And the normal body microflora, such as those described in the opening quote by Antony von Leewenhook, who discovered microorganisms, has an even larger variety of microorganisms.
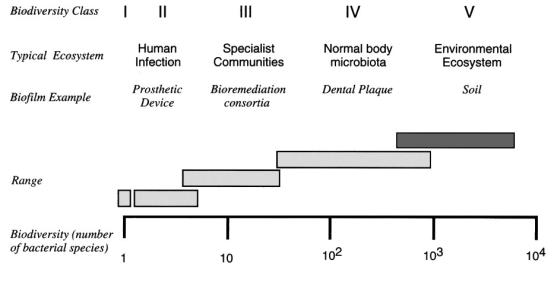
Figure 1: Biodiversity class of biofilms. From (Allison, et al. 2000)
But by far the most diversity is found in environmental ecosystems. This is important for bioprospecting applications, as a large number of organisms are competing with each other for food, water, and space. In order to survive, bacteria must fight over the limited nutrients. One way to do this by secreting chemicals that inhibit the growth, or kill other microorganisms. A familiar example is that of the fungus Penicillium, which was discovered by its effect of inhibiting the growth of bacteria growing round it. Similarly, organisms must try to extract every possible nutrient from their surroundings. This leads to the evolution of enzymes that can degrade fats, proteins, and carbohydrates down into simpler constituents. Some of these enzymes can also be useful to us. For example hemicellulases are used by some fungi to breakdown wood constituents, to us they are useful in the manufacture of pulp and paper products (Gibbs 1995). However there are problems facing the biotechnological exploitation of potentially useful organisms from such environments. It would be ideal if one could retrieve an environmental sample, and grow the microorganisms living in it, and look for potential enzymes. The problem is that we can culture only a fraction of the organisms within a particular environment (Table 1). It is commonly estimated that we can culture between one and ten percent of bacteria, and in some cases is may be much less than this. The vast majority of bacteria that we cannot grow are some times called 'unculturables' but are now often referred to as 'yet to be cultured' or 'as yet uncultured' since it is likely that given the right conditions we would be able to culture these organisms.
| Environment | Proportion of Culturability % |
|---|---|
| Seawater | 0.001 – 0.1 |
| Freshwater | 0.25 |
| Mesotrophic lake | 0.1 – 1 |
| Activated sludge | 1 – 15 |
| Soil | 0.3 |
Table 1: Estimates of the proportion of 'unculturable' microorganisms in various terrestrial and aquatic environments. (Modified from Cowan 2000)
Some bacteria must have specialised conditions to grow, these conditions may be difficult to replicate in the lab, additionally some may have adapted to live in microbial consortia, rather than monocultures. Whilst we could bioprospect with only the few bacteria we can culture, we would be missing out on the great diversity of the 'unculturables'. Hence many methods have been developed to explore this hidden diversity (Rondon, et al. 1999b). The techniques that are used in this project are designed such that no culturing of organisms from the environment need occur, this removes the 'culturable only' bias of some other methods. The techniques that were used in this project are in themselves not new, yet it is their application that is unique. One of the first papers to mention the possibility of using "uncultured prokaryotes from environmental samples," was Rondon et al. (1999a) who realised the potential of using bacterial BAC (Bacterial Artificial Chromosomes) libraries to access microbial diversity. Later that year the same authors published an overview of current methods of "assessing and accessing soil microbial diversity" (Rondon, et al. 1999b). This paper mentioned two different approaches using plasmids to clone portions of DNA from the metagenome. These methods are the BAC-cloning and expression-cloning approaches illustrated in Figure 2 below, and are the basis of the remaining papers discussed in this section.
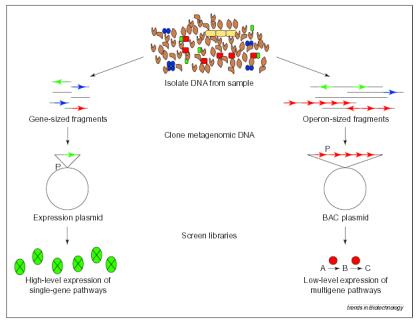
Figure 2: Comparison of the expression-cloning and BAC-Cloning approaches for capturing the soil metagenome.
Genes are represented by horizontal arrows, and promoters by the letter P. From (Rondon, et al. 1999b) It can be seen that expression plasmid cloning is more suited to isolation of single genes, whereas the BAC-cloning is useful for the isolation of multiple genes. In fact the large (100 kb) inserts of a BAC could contain an entire metabolic pathway (Rondon, et al. 1999b). Published in September 1999, Henne et al. used the expression cloning method to screen for the presence of 4-hydroxybutyrate utilisation genes in an environmental DNA library. This was the first time that such an approach had been published. The authors' cloned 5-8 kb fragments of DNA into the pBluescript SK+ plasmid, transformed the plasmid into an Escherichia coli strain (DH5a), and grew the transgenics on media containing 4-hydroxybutyrate. The success rate was quite low, only 5 stable phenotypes found out of 930000 clones screened. Three of those revealed no significant sequence homology to gene sequences available in the National Centre for Biotechnology Information databases (NCBI) (Henne, et al. 1999). This paper showed that the expression cloning technique is feasible and has the potential to discover novel genes. A comprehensive paper was published in June 2000, using the BAC-cloning method; by Rondon et al. They also constructed an environmental DNA library in E. coli, but used the BAC vector pBeloBAC11. Two libraries were constructed, SL1 and SL2, with the latter using refined construction techniques (allowing an average insert size of 44.5 kb in SL2, compared to 27 kb in SL1). The SL1 library was screened by multiple functional assays for: b-lactamase, cellulase, protease, keratinase, chitinase, lipase, esterase, amylase and DNAse activity; as well as Gram-positive antibacterials. From the 3648 clones in SL1, 1 DNAse, 1 antibacterial, 2 lipases and 8 amylases were discovered (Rondon, et al. 2000). This paper proved the feasibility of the BAC-cloning method and showed that multiple assays could be performed on a library to screen for many different kinds of activity. This projects focus is on single genes, thus utilises an expression vector system. Additionally the multiple assay aspect of Rondon et al. 2000 is also implemented to search for several different types of functional activity within the library.
- To construct several metagenomic libraries from different locations in the environment, using expression cloning.
- To test by functional assay these libraries for the presence of certain genes (lipases, proteases, hemicellulases, cellulases, and antimicrobial activity)
- To sequence some of the discovered genes, and compare the sequences to those currently known, to identify novel genes.
The methodology for this project can be separated into three distinct phases related to the aims above:
- Construction of a genomic DNA library containing fragments of environmental DNA (multiplex cloning)
- 'Scanning' the library for enzymes and anti-microbials (expression screening)
- Characterisation of the discovered enzymes and anti-microbials (at the level of DNA sequencing)
The environmental samples used were collected from the activated sludge reactor in the Rosedale wastewater treatment plant. Insufficient time was available to use samples from forest soils or fresh water, as originally anticipated. It is worth noting that although environmental samples are chosen for their diversity, not all organisms would be equally represented in these libraries. There will be a bias towards the more prevalent species, as they will quite simply contribute more DNA to the library. However certainly some, if not most, of these will be 'unculturable' bacteria. A large amount of DNA is required to construct a genomic library, due to the size of the library, ligation efficiencies and destructive screening strategies. Previous extractions have achieved 4 - 35 µg per gram of forest soil (dry weight) (Miller, et al. 1999). DNA from environmental samples encounters problems not associated with DNA extracted from pure colonies and macro-organisms. A key group of inhibitors are the humic acids present in soil and other environments. These are the soluble portion of humus (decomposed plant and animal matter) (Schut 1996) and are typically co-extracted in DNA purification protocols. They exhibit a brown colour and limit the efficiency of restriction enzyme digestion, ligation and PCR (Tebbe and Vahjen 1993). Other problems are incomplete cell lysis, DNA sorption to soil surfaces, and loss, degradation, or damage of DNA. A good DNA extraction protocol must take these factors into account. Several DNA extraction methods, including bead-beating and gentle lysis were used, to varying degrees of success (See the discussion for further analysis of DNA extraction protocols) Extracted genomic DNA must be prepared for ligation into an expression plasmid. The size of the insert is directly related to the number of genes it contains. Thus a smaller insert will have fewer genes and conversely a larger will have a greater number. Whilst more genes in an insert would mean that a greater proportion of the metagenome is being detected per clone, larger inserts have a lower ligation efficiency and transformation frequency is lower for larger plasmids. Furthermore more genes become too distant to the vector promoter. In addition plasmids of this type become unstable with an insert size of greater than 10 kb. Thus as a compromise the desired insert size for this project is 5 kb. This is of a comparable size to previous work by Henne et al (1999, 2000). To construct fragments of this size, the metagenomic DNA was cut with the restriction enzyme Sau3A and fragments between 4 and 6 kb selected. This enzyme is a methylation-insensitive frequent 4-cutter restriction endonuclease (5'- ¯GATC -3'). A partial digest was conducted as detailed in appendix 9.2.3 DNA fragment isolation and purification are detailed in the appendices. The pET (plasmids for expression by T7 RNA polymerase) system was used for the expression of the environmental metagenomic DNA. This system was primarily chosen for its excellent control of background leaky transcription. This is a problem for other systems such as the pBluescript vectors. Leaky promoters would be unfavourable in this system, as some of the clones will contain potentially harmful or lethal genes, particularly gram-negative antimicrobials and proteases.
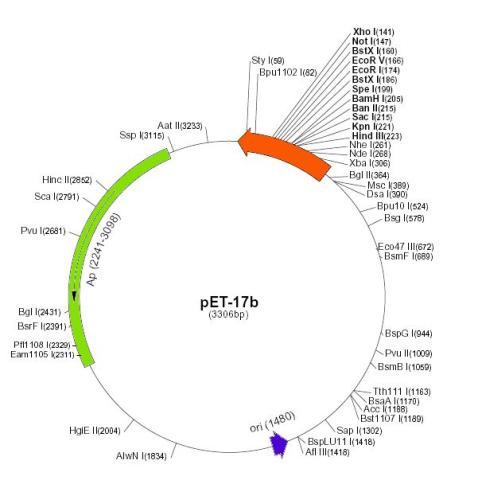
Figure 3: The pET-17b expression plasmid novagen product the sequences are numbered according to the pbr322 hence the t7 expression regions are reversed on the circular map. Sequence landmarks include: t7 promoter, t7 transcription start, multiple cloning sites Hind III – Xho I (141-223); (4) T7 transcription terminator (28-74); (5) pBR322 origin (1480); and (6) bla (Ap) coding sequence/ampcillin resistance region (2241-3098).
Target genes are cloned in pET plasmids under the control of bacteriophage T7 promoter. Expression is induced by providing a source of T7 RNA polymerase in the host cell. The specific vector that was used is pET-17b (Novagen Inc., Madison, WI, USA). This vector is a transcription and translation vector, however only the transcription properties were utilised. There are stop codons in all three reading frames following the multiple cloning site (MCS), as well as a downstream T7 transcription terminator (Tf). This terminator stops read-through to the adjacent Β-lactamase gene (ampR), which confers resistance to the antibiotic ampicillin (Hawkes 1998). Thus when the T7 RNA polymerase is induced it transcribes a single large mRNA covering the entire 5 kb insert, which is translated by the cytoplasmic ribosomes into proteins.
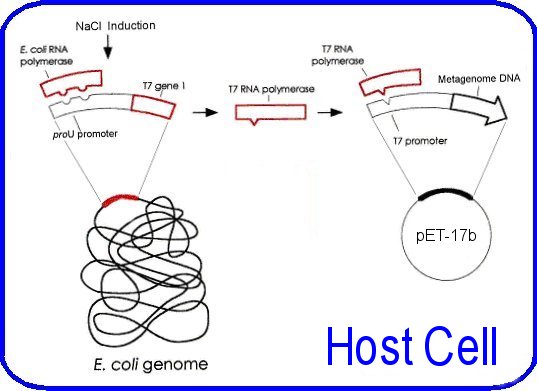
Figure 4: Control elements of the pet system from Hawkes pictured are the host and vector elements for control of t7 rna polymerase levels and the subsequent transcription of the metagenomic fragment in the pet-17b vector. The t7 rna polymerase gene is under the control of the proU promoter.
The host bacterium for the plasmid is E. coli BL21-SI [Genotype: F- ompT Ion hsdSB(rB-mB -) gal dcm endA1 proUp::T7 RNAP:: malQ-lacZ Tets] (Life Technologies) these cells are designed for inducible recombinant protein overexpression. They are notable from typical BL21 strains, as they permit expression from a T7 promoter using salt (NaCl) as the inducing agent, rather than IPTG. The cells contain a chromosomal insertion of the T7 RNA polymerase gene under control of the salt-inducible proU promoter. Titratable addition of NaCl to the media induces expression of the T7 RNA polymerase; this allows transcription of the genomic DNA insert downstream from the T7 promoter in the pET plasmid. Other features of this strain include the lack of several proteases (Ion and ompT) that can degrade expressed proteins; additionally it contains the endA1 mutation to increase plasmid yield and quality. (Life Technologies product manual) The additional control of the pLysS plasmid could not be implemented as originally proposed, as the strain of bacteria used did not contain this plasmid, and inserting it was beyond the scope of this project. These considerations allow the target genes in the DNA insert to remain as transcriptionally silent as possible, this is important for this application as the cloned genes have the possibility of being quite toxic to the host bacterium, indeed finding an anti-microbial effect is one of the desired outcomes of this project. Similarly most proteins when expressed at a high level can be toxic to the host. The insert sequence is under the control of the T7 promoter, this allows over expression of genes in the insert "such that the product can comprise up to fifty percent of the total cell protein after a few hours of induction" (pET system manual, Novagen). The plasmid is prepared for ligation by linearising it with the restriction enzyme BamHI (5'- G¯GATCC -3'), which gives complementary ends to Sau3A digested DNA, purified by running it thorough a gel, and treated with shrimp alkaline phosphatase to remove 5' phosphate groups. This last step prevents self-ligation and re-circularisation. The approximately 5 kb metagenomic fragments are ligated into the pET-17b plasmid by standard ligation techniques detailed in the appendices The pET plasmid was used to transform the competent E. coli strain to ampicillin resistance by the heat-shock methods recommended by the manufacturer (Life Technologies) Transformed bacteria are then spread onto large LBON plates (LB agar with no salt) containing ampicillin. The metagenomic library consists of the colonies that grow on these plates. NOTE: The methodology passed this point was not completed due to insufficient time and complicating factors detailed in the discussion section. But is included here to help understand the direction of the project. The libraries would have been screened for enzymes and antimicrobial activity by overlaying the library plates with soft agar containing the inducing agent for expression (NaCl), and the substrate that is being tested. In the case of a lipase, the substrate would be a triglyceride, whereas in the case of an antibacterial agent the 'substrate' would be bacteria. The library would have been screened for lipases, proteases, cellulases, and hemicellulases. Antimicrobial activity would have been tested against Escherichia. coli (Gram negative), Bacillus subtilis (Gram positive), and Saccharomyces cerevisiae (yeast). 1. Triacylglycerol lipase [EC: 3.1.1.3] (Lipase) The assay for lipases tests the ability of bacteria to degrade the triglyceride: triolein (Sigma Chemical Co. MO. USA). The soft agar overlay will contain triolein (1% vol/vol) and the fluorescent dye rhodamine B (0.001% wt/vol) (Sigma). Positive lipase activity is scored by the presence of an orange fluorescent halo around a colony, on exposure to UV light of 254 nm (Henne, et al. 2000). 2. Protease The assay for proteases tests the ability of bacteria to degrade the proteins in milk, chiefly k-casein. The soft agar overlay will contain non-fat milk powder (1% wt/vol). Positive protease activity is scored after 3 days for the presence of a clear halo (Rondon, et al. 2000). 3. Endo-1,4-b-glucanlase [EC: 3.2.1.4] (Cellulase) The assay for cellulases tests the ability of bacteria to degrade carboxymethyl cellulose (CMC). The soft agar overlay will contain CMC (0.1% wt/vol). The plates are incubated, stained with Congo red dye, and then destained (Teather and Wood 1982). Positive cellulase activity is scored as presence of a yellow halo against a red background. 4. Endo-1,4-b-xylanase [EC: 3.2.1.8] (Xylanase) The assay for hemicellulases tests the ability of bacteria to degrade oat spelts xylan (OSX). Xylan is the major hemicellulose in plant tissue. The soft agar overlay will contain OSX (0.5% wt/vol) (Morris 1997). The plates are incubated, stained with Congo red dye, and then destained (Teather and Wood 1982). Positive xylanase activity is scored as presence of a yellow halo against a red background. The test for antimicrobial activity will involve adding one of the previously mentioned organisms (E. coli, B. subtilis or S. cerevisiae) to the soft agar overlay. Plates are then incubated and scored for the presence of a clear area in the lawn of overlaid organisms. Those organisms hosting the plasmids will also be killed, however the plasmid DNA can be recovered from the clear area on the agar Once a plate has been used for an assay, the library colonies will have been destroyed, however there may have still been potentially useful enzymes or antimicrobials in the other organisms on the plate. For example one plate might be tested for lipase producing bacteria, yet harbour a hemicellulose degrading bacteria, which will remain undiscovered. One way around this is to make 7 identical replica plates from a single master plate, one for each test (4 enzymes and 3 antimicrobials). However with up to 50 000 colonies on a single plate, creating multiple replicate plates can lead to blending of colonies. An alternative method is to attempt to combine some of the assays onto a single plate, and have sufficient plates for multiple representation of the library. There are some limitations to this however; firstly the assay results must be clearly distinguishable from each other on the plate. An example is the screening for cellulose and hemicellulose, both have the same final appearance, thus could not be combined on a plate. Additionally the antimicrobial tests must be kept separate from each other. Suggested combinations follow:
- Protease (clear halo) and Lipase (orange halo)
- G- Antibacterial (clear halo) and Cellulase (yellow halo)
- G+ Antibacterial (clear halo) and Hemicellulases (yellow halo)
- Antifungal (clear halo)
This would require a slight alteration in the experimental procedure with two substrates added to most soft agar overlays. In the antibacterial plates, first the plates are scored for antibacterials, and positive colonies removed. Then the plates would have been stained with Congo red to reveal the cellulases and hemicellulases. Once a colony of interest has been identified by the functional assay methods above, the next task is to isolate the plasmid from the dead organisms in the colony. The plug of agar containing the colony of interest is picked from the plate, and plasmid DNA is extracted by standard phenol/sodium acetate/ethanol methods (Kate Griffiths - personal communication). Note that this preparation will contain the pBluescript plasmid from the overlay organism as well. Plasmid DNA is then inserted back into E. coli BL21-SI, and spread on a plate containing LBON agar with ampicillin, X-gal and IPTG. This media will allow differentiation between bacteria carrying the pBluescript and pET-17b plasmids, as the pBluescript colonies would have been blue due to hydrolysis of X-gal by b-galacotosidase. Plasmid DNA would have then be recovered from the white colonies and tested for the presence of an insert. Sequencing of the insert DNA in the pET-17b plasmid would have been performed at the DNA Sequencing and Genotyping Unit at the School of Biological Sciences, Auckland University. The sequence would have been scanned for open reading frames (OFR), which will indicate potential genes, and the OFR's compared to sequences in publicly available databases for homology with other known genes. The discovery of novel genes has the potential to be very significant. It is possible that new genes have characteristics that may be desirable to the manufacturing or pharmaceutical industry. Lipases are important in biotechnology because of their extreme versatility in substrate specificity and stereoisomer selectivity. Enzymatic hydrolysis of fats to glycerol and fatty acids is superior to chemical methods. Chemical methods result in poor quality products, from contaminants and side reactions that occur at the high temperatures used. Lipases are currently used in the food industry and in bioremediation applications, but have a huge potential in the pharmaceutical industry, to obtain pure compounds, rather than racemic mixtures of drugs that chemical methods create. Hemicellulases have the potential to be very important to the pulp and paper industry. Paper is currently bleached, by expensive and environmentally damaging chemicals (either chlorine or hydrogen peroxide). This is done to remove the brown colour from paper, which comes from the molecule lignin. Hemicellulases (specifically xylanases) help this process, as during processing xylans can re-precipitate onto wood fibres, making the lignin harder to remove. Xylanases hydrolyse the xylan, which in turn, solublises the lignin (Gibbs 1995). Enzymatic methods allow the white paper that consumers demand, with reduced environmental impact, and if implemented correctly, cost savings. Overuse and incorrect use of antibiotics has, in recent years, lead to the emergence of 'superbugs', pathogenic bacteria that are resistant to one or more antibiotic therapies (Prescott, et al. 1999, pg 691). It may be essential to find new types of drugs that kill microorganisms, to combat this threat. Recent bioterrosim events also suggest the wisdom of having a broad spectrum of new antimicrobials available.
5.0 Results
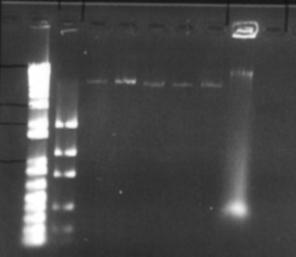
Figure 5: Initial plasmid amplification. The first two lanes are the size (1kb+) and mass ladders respectively. The next 5 lanes are the plasmid preps, whilst last lane is the original pET-17b solution used in the transformation
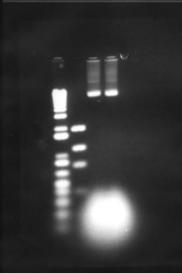
Figure 6: Maniatis et al plasmid amplification protocol. The two right-most lanes are two plasmid preparations
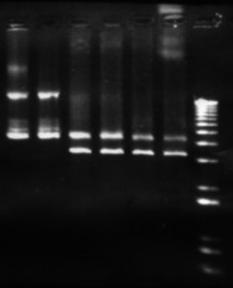
Figure 7: Plasmid analysis. The left most lanes are undigested pET-17b form the Maniatis et al prep. the last 4 lanes are digestions by BamHI, HindIII, and EcoRI , each of which have a single restriction site within this plasmid.
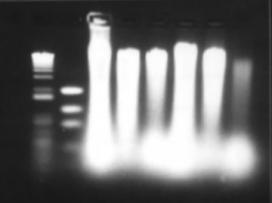
Figure 8: Bead-beater DNA extraction. Six samples were extracted from with the bead-beater protocol and the pellet suspended in 50µL of TE, 5µL of this was loaded into each well here.
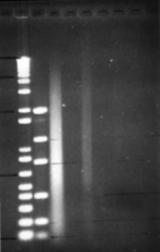
Figure 9: Serial dilution of a bead-beater extraction. Dilutions range from 1:10 to 1:10000, in alternate lanes. RNase treated before loading. Note extreme shearing
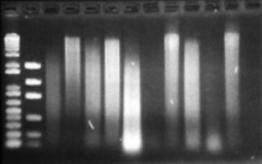
Figure 10: Reanalysis of DNA extractions after nearly one month at 4°C. This may show evidence of nuclease activity over time.
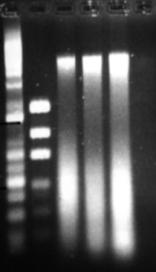
Figure 11: Phenol modification of Bead-beater protocol. Three extractions from which 2µl of DNA solution was loaded in each well.
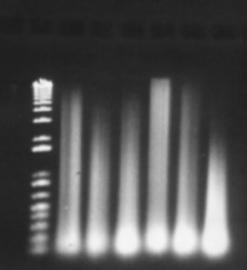
Figure 12: "Short protocols" DNA extraction method. Results showing six extractions. 2µL of product was loaded per well.
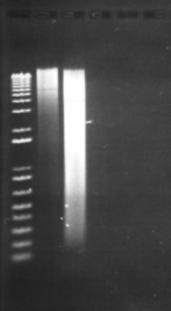
Figure 13: Modified Porteous et al DNA extraction method. The leftmost lane beside the ladder is the DNA extracted from 500µL of activated sludge. The other visible lane consists of DNA extracted from 1500µL of activated sludge, spun into a pellet. The remaining lanes consist of extractions following the original Porteous et al method (No visible DNA was extracted). 2µl of product was loaded in to each lane.
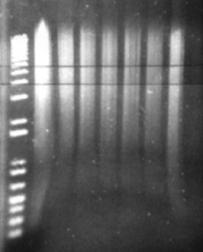
Figure 14: Sau3A digestion of a metagenomic DNA sample. The leftmost lane is the undigested control. The remaining lanes are serial dilutions of the restriction enzyme. Horizontal parallel lines represent the desired fragment range between 4 and 6 kb.
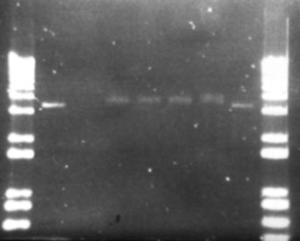
Figure 15: Ligation products from pET-17b and metagenomic DNA fragments. Exposure time was 2.16 seconds to visualise the faint bands. 5µL of ligation product loaded. Full description in the discussion
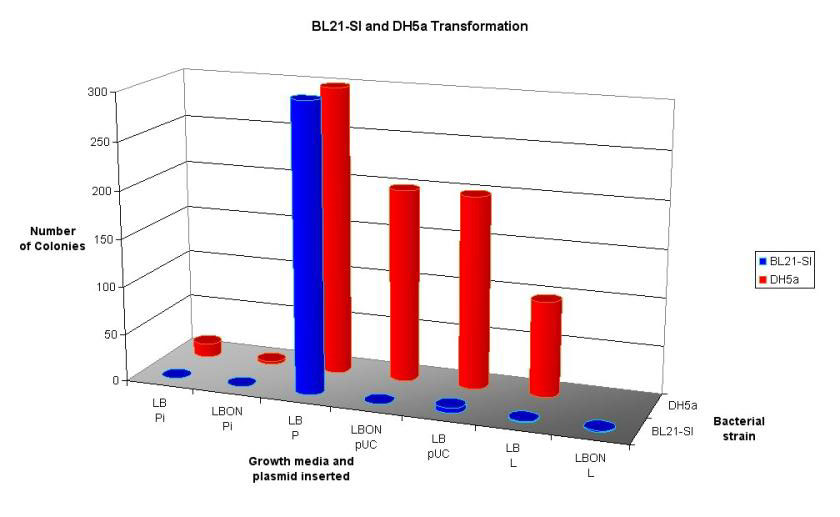
Figure 16: 3D graph showing the results from a trial transformation with BL21-SI and DH5a. See Discussion for full details.
6.0 Discussion
It is unfortunate that this discussion section will primarily focus on the reason as to why this project did not go to completion, rather than a discussion of the results achieved. The primary reason for the non-completion of this project is a shortage of time, nothing suggested that the methodologies utilised here were at fault, merely that due to several complicating factors, some steps took more time than was anticipated. Below these factors are discussed.
6.1 Plasmid Amplification Difficulties
The expression plasmid pET-17b was required to carry and express a fragment of metagenomic DNA. No commercial preparation of this plasmid was purchased, however a small amount suitable for transformation was obtained from -80°C storage, having previously been use by another researcher (Hawkes 1998). The plasmid was inserted into Max efficiency DH5a E. coli (Life Technologies), and grown and purified according to the Concert plasmid purification kit (Life Technologies). Figure 5 shows that the yield of plasmid is very low. This was attributed to insufficient volume in the growth vessel, causing poor oxygenation and growth of bacteria. Additionally there was a problem finding suitable equipment for the high-speed centrifugation of 4 mL of liquid at 15000g. Splitting this volume into microfuge-sized aliquots was not feasible as an excessive amount of SDS-protein precipitate clogged up the narrow bore of the microfuge tube, restricting removal of the supernatant. Ultimately the high-speed centrifugation step was carried out in a Sorvall RC-5B centrifuge, with the SA-600 rotor and polycarbonate tubes. Despite these measures taken the yield was still poor. Thus it was decided to eschew the quick 'kit' methods and fall back upon established plasmid amplification protocols. The next method used was from 'Molecular Cloning' by Maniatis et al. This protocol uses a large culture volume (500 mL) and chloramphenicol to amplify plasmids. Chloramphenicol is an antibiotic that inhibits protein synthesis in bacteria, this leads to inhibition of replication of chromosomal DNA, however replication of relaxed plasmids continues (Clewell 1972). The plasmid was extracted from the cells by the alkaline lysis method (Maniatis et al 1982) see appendix 9.2.2.2. The protocol is lengthy, however it yields large amounts of relatively clean plasmid (see figure 6). An additional RNase / phenol treatment was used to clean this preparation. Running these purified products however, revealed new intricacies. What was previously seen as a single large clean band, now appeared as three distinct bands on the gel. This is in itself not unexpected, as for a single plasmid the supercoiled, linear and nicked circular forms have different motility through agarose gels (the linear form should run at 3306 bp). One problem with the amplification and lysis methods used, is that long exposure to chloramphenicol results in the synthesis of plasmids whose DNA has partially been substituted by ribonucleotides. Because these small regions of ribosubstitution are sensitive to cleavage by alkali, some preparations can contain unusually large amounts of nicked circular molecules (Maniatis et al 1982). However all forms should run the same when linearised by a restriction enzyme. This was tested by digesting a portion of the plasmid prep with the restriction endonuclease BamHI this enzyme has a single restriction site in the pET-17b plasmid. One digest was left to incubate overnight, another for a single hour (both at 37°C). Interestingly the restriction product did not give a single band as expected but two (Figure 7). No difference was seen between the two incubations, although it is possible that in the overnight incubation BamHI denatured due to the temperature and no further restriction was possible. Other restriction enzymes with a single restriction site in this plasmid also showed the same pattern. The exact cause of these aberrant bands is unknown. However these qualities did not seem to affect the ability to confer antibiotic resistance on E. coli (see section 6.3)
6.2 High Quality DNA Extraction Difficulties
The metagenomic DNA extracted from the activated sludge needs to have two important properties, High concentration and high quality. High concentration is necessary as much DNA is lost during restriction digestion to obtain the 4-6 kb fragments. High quality DNA is necessary for a high quality library. Figure 8 shows the bead beater method of DNA extraction, it is readily apparent that there is ample concentration of DNA, however no firm conclusion can be formed about the quality of the DNA due to excessive overloading of the wells. A subsequent serial dilution seemed to indicate severe shearing of the DNA (Figure 9). After a period of 27 days, during which the work was focused on the plasmid, the DNA products were re-analysed on an agarose gel, along with four new samples (Figure 10). All these products show a high degree of shearing. It was thought that since the bead beater extraction method has no enzyme-denaturing step, extant nucleases could have degraded the DNA whilst it was in storage at 4°C. Another possibility is rough handing, hence from this point onwards, all DNA solutions were pipetted with large bore tips created by cutting the end off a standard pipette tip. This technique reduces shear forces acting on the DNA significantly. Shearing is undesirable as it breaks DNA into smaller fragments. If these fragments are less than about 7 kb long they will occupy the space on the gel where the desired 4-6 kb fragments would be extracted. The difference between sheared fragments and restricted fragments is that sheared products would not contain the correct 'sticky end' for ligation into the expression plasmid. Thus the presence of this sheared DNA would reduce the ligation efficiency. Due to the supposed activity of nucleases degrading the DNA, a phenol extraction step was added to the standard bead-beater protocol. Phenol is an effective enzyme denaturant, and is commonly used as a clean-up step in DNA extractions. The DNA samples were extracted by this modified method (Figure 11). However during the extraction protocol 5M KOAc was inadvertently substituted for 7M NH4OAc. No detrimental effect was observed; indeed the DNA bands were the best yet observed. Unfortunately an unrelated problem with the 1kb+ size ladder made it difficult to determine the size of the bands. In hindsight using KOAc instead of NH4OAc was serendipitous as it is suspected that this was supposed to be in the protocol rather than NH4OAc (Susan Turner - personal communication). The potassium ions may replace the sodium ions in SDS causing precipitation of insoluble KDS. The leftmost sample was chosen for use in the optimisation of the next step, creating the desired 4-6 kb fragments by restriction enzyme digestion. The final protocol is listed in appendix 9.2.3. However settling on this protocol took many weeks of optimisation. The primary difficulty was getting the concentration of enzyme (Sau3A) DNA correct, too little and no significant digestion occurred, too much and hardy any fragment were seen in the correct range. Additionally, since the incubation time was only 15 minutes long, it was found that the time between the end of incubation and loading on the agarose gel for analysis was significantly effecting the results, since the enzyme was still degrading DNA over this time. Three strategies were utilised to combat this effect. The first method was heat inactivation; the literature differed as to whether Sau3A was heat-inactivatible or not. The Roche data sheet for this enzyme states "there is no information about Sau3A and heat inactivation available", yet the Life Technologies manual suggested 65°C for 10 minutes. In practice heat inactivation was not found to be useful, either the enzyme is not inactivated by heat, or the act of heating the sample up to 65°C after incubation causes a burst of activity that excessively degrades the DNA. Another inactivation method tried was the addition of EDTA after incubation, to a final concentration of 50mM, to chelate and thus remove Mg2+ ions necessary for the enzyme to function. No significant inhibition of restriction was found to occur by this method. The most successful method was not to inactivate the enzyme at all but rather to keep the samples on ice, and use a chilled running buffer as detailed in appendix 9.2.3. Nevertheless, as can be seen in the serial digestion in Figure 14, degradation of DNA in the undigested controls overlaps far into the desired 4-6 kb region. It was suspected that the DNA extraction protocol itself might be at fault. The bead-beater extraction method works by lysing the cells by vigorous shaking with small beads, this is extremely effective method of release DNA from cells, however it does cause some degree of shearing. Alternate, gentler DNA extraction methods exist, and some of these were tried below. This method was taken from the book 'Short Protocols in Molecular Biology' 4th ed. (Ausubel, et al. 1999; pg 2-12). It was thought that this method would be preferable to the bead-beater method as it uses a slow and gentle SDS/proteinase K digestion to lyse bacterial cells and to elaborate DNA. An interesting observation about this protocol was after adding the phenol/chloroform/isoamyl alcohol in step 5, the aqueous phase turned pink. See Figure 17 below.
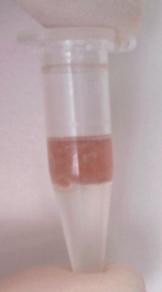
Figure 17: Pink coloured aqueous solution elaborated during DNA extraction protocol
Often this can be attributed to expired phenol, however the buffer saturated phenol used here was new, and had no colouring. Another possibility is that coloured bacterial compounds were elaborated, however this was not seen in any other method of DNA extraction. The pink colouring was retained through isopropanol precipitation and ethanol washing steps. The result from 6 samples processed in this manner can be seen in Figure 12. These products are of very poor quality, with extreme shearing and a low amount of high molecular weight DNA. The cause of this DNA degradation is unknown, careful handing procedures were used throughout as detailed above, thus the cause must lie in the protocol. The co-purification of the pink compound would seem to indicate this.
High molecular weight dna extraction from soil
This protocol is from a paper published in 'Molecular Ecology' in 1997 by Porteous et al. This method was designed to extract DNA directly from soil, whilst not co-purifying humic acids. The protocol (see appendix 9.2.1.3) begins with a hot SDS lysis step, which contains guanidine isothiocyanate (GITC) to denature proteins including nucleases. An interesting component of this protocol is the use of polyethylene glycol (PEG), rather than isopropanol, to precipitate DNA. The reason for this is that alcohol products have been reported to facilitate the co-purification of humic substances. However in practice this method is quite awkward, the PEG precipitation seemed to work poorly, SDS was not removed effectively, and the DNA pellet was too easy to loose in the interface between layers. No DNA at all was extracted from this method. However the initial lysis step is good as it causes gentle lysis of the bacterial cells, reducing DNA degradation. The early inclusion of GITC also destroys potential DNA degrading enzymes. For these reasons a modified protocol combining the lysis step from Porteous et al, and the DNA recovery step from the bead-beater method was used. (See Appendix 9.2.1.4) The result from this new method was promising. Figure 13 shows the DNA products that were obtained. These samples show high molecular weight DNA, and the leftmost sample shows minimal shearing, however some is still present in the desired 4-6 kb region. At this point the decision was made to continue on with the project using this sample, even though it had sheared DNA in the target region. By this time two thirds of the allocated time for the project has passed, the decision was made to move forward rather than continue to optimise one of the very early steps. However if more time were available, different techniques would have been used to ensure high quality DNA. These methods would be dawn from the same methods used to create BAC libraries for genome sequencing and functional genomics projects. Such techniques include pulse-field electrophoresis to isolate large fragments of DNA (Rondon, et al. 2000), Caesium chloride gradients, and bacterial lysis in agarose plugs to protect the DNA. (Rondon, et al. 1999a) The methods for digestion of DNA and isolating the 4-6 kb fragments worked well, especially the technique of running the excised fragments through the gel again, this compacts the size of the gel that needs to be extracted by one third. Purifying the fragments through the High Pure kit (Roche), gave a clean product but very dilute. Plasmid linearisation with BamHI and ligation of the metagenomic fragments were performed as per the protocols in appendix 9.2.4 After ligation of these fragments into the linearised plasmid, they were transformed into E. coli strain BL21-SI by the recommended methods, and plated on salt-free LBON medium. No colonies were present on any plates, except for a few (3) on the positive control (stock pET-17b). A similar result occurred on a subsequent transformation. It is very surprising that the transformation failed. Possible reasons include: Insufficient DNA for transformation, failure of ligation, problems with the competent cells or media, or poor handling procedures. The latter is unlikely as the plasmid pET-17b was very successfully inserted into 'Max Efficiency' DH5a cells (Life Technologies) previously. Ligation products were analysed on an agarose gel to determine the cause of the problem (Figure 15). In order to see the bands on this gel the exposure time had to be increased 4 to 6-fold over nominal values, this may indicate that the concentration was insufficient for transformation (although in the second transformation the amount of DNA used was increased 5-fold). The first two lanes show the concentration of the linear plasmid and the metagenomic fragments respectively, the plasmid concentration is low, but the metagenomic fragment concentration is so low it cannot be seen here, but could be visualised when 10µL was loaded on a separate gel (data not shown). Lane one is the no-metagenomic DNA control; this appears no different to the next three lanes, which are a series of increasing metagenomic DNA concentration. The product in lane one would have been expected to run the same as the linear plasmid, since no self-ligation should be possible due phosphoralation treatment. The last lane is the no-ligase control. This clearly shows that self-ligation is not occurring. Note that the size of ligated products cannot be determined from this gel as intact plasmid has different gel motility that linear plasmid. To determine whether there was a problem with the competent cells used or the salt-free media effects cell growth, a multifaceted transformation was performed to test various aspects of this procedure. Figure 16 summaries these results. Two strains of E. coli were used, the salt inducible BL21-SI and 'Max Efficiency' DH5a designated by blue and red bars respectively (both Life Technologies). The number of colonies is indicated by the height of the bars. Note that a value of 200 means that over 200 colonies were present, 300 indicates that there were too many bacterial colonies to count. The X-axis is more complicated. Here LB and LBON are the type of media used (standard and salt-free respectively). 'Pi' is pET-17b after ligation with the metagenomic fragments, 'P' is stock pET-17b, 'pUC' is pUC19 control plasmid supplied with the competent cells, and 'L' is a positive ligation control (plasmid with insert) from the Teasy system. Several conclusions can be drawn from this graph. Firstly if the different strains of bacteria have similar transformation efficiencies, one would expect the number of colonies to be similar for each set of conditions. This is clearly not the case, with the salt-inducible BL21-SI cells transforming poorly compared to DH5a. The exception to this is the stock pET-17b that performed equally in both strains. Another conclusion is that the absence of salt in the media presents no problem to the growth of E. coli this can be seen by the pUC/DH5a transformation growing to similar colony numbers on both types of medium. This shows that LBON medium, when used to prevent expression of the insert DNA, is not detrimental to E. coli. The first two columns (Pi) should show the desired library. Again here it can be seen that transformation efficiency is higher in the DH5a cells (no colonies were observed for the BL21-SI cells). An important observation is that even using DH5a cells the number of colonies was very low in comparison to the positive controls. Based on the data above on the analysis of ligation products, it is likely that this is due to low DNA concentrations in the ligation mix. Comparing the Data for the two strains seems to suggest problems with the BL21-SI competent cells, as their overall transformation frequency was much less than that of a comparable strain from the same company.
7.0 Conclusions
Due to the non-completion of this project, no conclusions can be drawn about the originally anticipated goal of obtaining novel genes. However some conclusions can be drawn about the methodology used in this project to achieve this goal. Firstly it was found that established methods of plasmid amplification, in this case, work much better than 'off the shelf' kits. The 1982 protocol from Maniatis et al. gave much higher yields than the Concert Plasmid Purification kit (Life Technologies). Although there is some suspicion that this method caused aberrant banding, possibly due to nicked circular forms of plasmid DNA. Several DNA extraction protocols were evaluated to no great success. The method that gave the highest yield was Bead-beating, however this sheared DNA excessively. The best protocol used was a modified form of the Porteous et al. method using a slow and gentle initial lysis step. Further modification of this protocol is still necessary to get good quality high molecular weight DNA. Finally some evidence suggests that the competent cells (BL21-SI) used in the construction of the metagenomic libraries, may be in some way defective.
8.0 References
Allison, D. G., P. Gilbert, H. M. Lappin-Scott, and M. Wilson 2000. SGM Symposium 59: Community Structure and Co-operation in Biofilms. Cambridge University Press.
Ausubel, F. M., R. Brent, R. E. Kingston, D. D. Moore, J. G. Seidman, J. A. Smith, and K. Struhl 1999. Short Protocols in Molecular Biology, New York.
Clewell, D. B. 1972. Nature of Col E 1 plasmid replication in Escherichia coli in the presence of the chloramphenicol Journal of Bacteriology. 110:667-76.
Cowan, D. A. 2000. Microbial genomes--the untapped resource Trends in Biotechnolology. 18:14-6.
Gibbs, M. D. 1995. P.H.D Thesis. Hemicellulases from extremely thermophilic microorganisms as wood pulp bleaching aids. The University of Auckland.
Griffiths, K. 2001. Methods. Macquarie University, Sydney. (Personal Communication
Handelsman, J., M. R. Rondon, S. F. Brady, J. Clardy, and R. M. Goodman 1998. Molecular biological access to the chemistry of unknown soil microbes: a new frontier for natural products Journal of Biological Chemistry. 5:R245-9.
Hawkes, S. L. J. 1998. P.H.D Thesis. Molecular Studies of Adrenoleukodystrophy and Emery-Dreifuss Muscular Dystrophy. The University of Auckland.
Henne, A., R. Daniel, R. A. Schmitz, and G. Gottschalk 1999. Construction of environmental DNA libraries in Escherichia coli and screening for the presence of genes conferring utilization of 4- hydroxybutyrate Applied and Environmental Microbiology. 65:3901-7.
Henne, A., R. A. Schmitz, M. Bomeke, G. Gottschalk, and R. Daniel 2000. Screening of environmental DNA libraries for the presence of genes conferring lipolytic activity on Escherichia coli Applied and Environmental Microbiology. 66:3113-6.
Maniatis, T., E. F. Fritsch, and J. Sambrook 1982. Molecular Cloning. Cold Spring Harbor Labratory, New York.
Miller, D. N., J. E. Bryant, E. L. Madsen, and W. C. Ghiorse 1999. Evaluation and optimization of DNA extraction and purification procedures for soil and sediment samples Applied and Environmental Microbiology. 65:4715-24.
Morris, D. D. 1997. P.H.D Thesis. Isolation of xylanase genes from extremely thermophilic bacteria as potential kraft pulp bleaching aids. The University of Auckland.
Porteous, L. A., J. L. Armstrong, R. J. Seidler, and L. S. Watrud 1994. An effective method to extract DNA from environmental samples for polymerase chain reaction amplification and DNA fingerprint analysis Current Microbiology. 29:301-7.
Prescott, L. M., J. P. Harley, and D. A. Klein 1999. Microbiology. WCB McGraw-Hill, Boston.
Rondon, M. R., P. R. August, A. D. Bettermann, S. F. Brady, T. H. Grossman, M. R. Liles, K. A. Loiacono, B. A. Lynch, I. A. MacNeil, C. Minor, C. L. Tiong, M. Gilman, M. S. Osburne, J. Clardy, J. Handelsman, and R. M. Goodman 2000. Cloning the soil metagenome: a strategy for accessing the genetic and functional diversity of uncultured microorganisms Applied Environmental Microbiology. 66:2541-7.
Rondon, M. R., R. M. Goodman, and J. Handelsman 1999. The Earth's bounty: assessing and accessing soil microbial diversity Trends in Biotechnolology. 17:403-9.
Rondon, M. R., S. J. Raffel, R. M. Goodman, and J. Handelsman 1999. Toward functional genomics in bacteria: analysis of gene expression in Escherichia coli from a bacterial artificial chromosome library of Bacillus cereus Proceedings of the National Academy of Sciences USA. 96:6451-5.
Schut, P. 1996. Humic acids. Agriculture and Agri-Food Canada. [Web Page] http://sis.agr.gc.ca/cansis/glossary/humic_acid.html [Accessed: 26 July 2001]
Teather, R. M., and P. J. Wood 1982. Use of Congo red-polysaccharide interactions in enumeration and characterization of cellulolytic bacteria from the bovine rumen. Applied and Environmental Microbiology. 43:777-80.
Tebbe, C. C., and W. Vahjen 1993. Interference of humic acids and DNA extracted directly from soil in detection and transformation of recombinant DNA from bacteria and a yeast Applied and Environmental Microbiology. 59:2657-2665.
Turner, S. 2001. PSC-B (Phosphate, SDS, Chloroform-Bead Beater) method for DNA extraction from environmental samples. The University of Auckland.(Personal Communication)
Appendices
Glossary
Amp — ampicillin bp — base-pair CTAB — hexadecyltrimethlyammonium bromide EDTA — ethylenediamine-tetra-acetic acid IPTG — isopropyl-b-D-thiogalactopyranoside Kb — kilo base-pair KOAc — potassium acetate M — molar; moles/L NaOAc — sodium acetate NH4OAc — ammonium acetate RCF — relative centrifugal force (in g) RNase — ribonuclease 1 (pancreatic) rpm — revolutions per minute SDS — sodium dodecyl sulphate Tris — 2-amino-2-(hydroxymethyl)propane-1,3-diol TE — Tris / EDTA (10 mM : 1 mM) X-Gal — 5-bromo-4-chloro-2-indoyl-b-galactopyranoside
9.2 Methods
9.2.1 DNA Extraction Methods
9.2.1.1 Bead-beater DNA Extraction Method
Phosphate buffer — (100 mM NaH2PO4 pH 8.0), SDS lysis buffer — (100 mM NaCl, 500 mM Tris pH 8.0, 10% SDS), Chloroform-isoamyl alcohol (24:1), 7M Ammonium acetate, Isopropanol (Analar), 70 % Ethanol, Bead-beater vials - ie 2 ml, screw capped, conical bottom, polypropylene tubes containing 0.5 g each of 0.1 mm and 3.0 mm silica-zirconium beads.
- Pellet sample in a 1.5 ml microfuge tube and resuspend in 300 µl of phosphate buffer. Add 300 µl SDS lysis buffer, mix gently and transfer to a 2 ml polypropylene bead beater vial then add 300 µl of chloroform-isoamyl alcohol.
- Shake vials in a FastPrep machine (Bio101) or equivalent at 4.5 m/s for 40 seconds. Spin in microfuge at full speed (13200 rpm) for 5 minutes to pellet cell debris.
- Transfer the supernatant (approx 650 µl) to a clean microfuge tube. Add 7M NH4OAc (or KOAc? See discussion 6.2.1) to achieve final concentration of 2.5 M (approx 360 µl). Shake by hand to mix and spin at full speed (13,200 rpm) for 5 minutes. This should produce a clear supernatant. The colour should be extracted from the sample into the lower organic phase with the SDS forming a thick gel-like interphase.
- Transfer the supernatant (approx 580 µl) to a new tube. Add 0.54 volumes (315 µl) of isopropanol and incubate at room temperature for 15 minutes. Spin at full speed (13,200 rpm) for 5 minutes.
- Carefully remove supernatant and wash pellet with 1 ml of 70% ethanol. Spin at full speed (13,200 rpm) for 5 minutes, remove supernatant and allow pellet to air dry (15-45 minutes).
- Resuspend DNA pellet in 100 µl of TE buffer.
Suppliers Zirconia Beads and conical vials - BioSpec Products http://www.biospec.com. NZ agents BioLab Scientific (formerly a SCI TECH brand). Linear polyacrylamide - Molecular Research Centre Inc, USA. NZ agents Progenz Ltd.
9.2.1.2 "Short Protocols" Bacterial Genomic DNA Extraction
SDS Lysis buffer: Add 8 ml H20 to 3 g SDS, then add 15 ml 1.0 M Tris pH 8.0 and 0.6 ml 5 M NaCl. Heat gently to dissolve and adjust final volume to 30 ml with H20. Materials: TE Buffer, 10% (w/v) sodium dodecyl sulphate (SDS), 20 mg/mL proteinase K, 5M NaCl, 10 ´ CTAB/ NaCl solution, 24:1 chloroform/isoamyl alcohol, 25:24:1 phenol/ chloroform/isoamyl alcohol, Isopropanol, 70% ethanol
- Pellet 1mL of settled activated sludge
- Resuspend pellet in 567 µL of TE buffer by repeated pipetting. Add 30 µL of 10% SDS and 3µL of 20 mg/mL proteinase K, mix and incubate for 1 hour at 37°C.
- Add 100 µL of 5 M NaCl and mix thoroughly. Add 80 µL CTAB/NaCl solution, mix and incubate 10 min at 65°C.
- Add equal volume chloroform/isoamyl alcohol, mix, and microcentrifuge 4 to 5 min. transfer the supernatant to a fresh tube.
- Add equal volume phenol/ chloroform/isoamyl alcohol, mix and microcentrifuge 5 min. transfer supernatant to a fresh tube.
- Add 0.6 volumes isopropanol and mix gently until DNA precipitates. Microcentrifuge briefly and wash with 1 mL of 70% ethanol
- Microcentrifuge 5 min, discard supernatant and let pellet air-dry. Resuspend in 50 µL of TE buffer.
9.2.1.3 High molecular weight DNA extraction from soil (Porteous et al) Homogenise Sample Weigh 500 mg soil in 2 mL microfuge tube. Add 925 µL SDS lysis buffer and 75 µL 5 M guanidine isothiocyanate. Vortex for 1 min. Lyse Cells Incubate 1 hour at 68°C and microfuge 13000g for 15 min. save 600µL supernatant liquid in clean 2mL tube
Concentrate Crude Extract
Add 75 µL 5M potassium acetate and 250 µl 40% polyethylene glycol 8000. Precipitate at least 15 min at -20°C and microfuge 13000g for 15 min.
Clean Crude Extract
Dissolve pellet in 900 µL 2 ´ CTAB and incubate 15 min 68°C. Add 900 µL chloroform, gently mix and microfuge 13000 g for 10 min. Precipitate aqueous DNA with 1 mL isopropanol for at least 15 min at -20°C. microfuge 13000g for 15 min. Dissolve pellet in 450 µL 2.5M ammonium acetate and add 1mL 95% ethanol. Precipitate at least 15 min at -20°C and microfuge 13000g for 15 min. Resuspend pellet in 50 µL TE SOLUTIONS: SDS lysis buffer: 0.25 M NaCl, 0.1 M EDTA, 4% SDS 2 ´ CTAB: 2% CTAB, 1.4 M NaCl, 0.1 M EDTA
9.2.1.4 Modified Porteous DNA Extraction Protocol
Homogenise Sample Weigh 500 mg soil in 2mL microfuge tube. Add 925 µL SDS lysis buffer and 75 µL 5 M guanidine isothiocyanate. Vortex for 1 min. Lyse Cells Incubate 1 hour at 68°C and microfuge 13000g for 15 min. save 600 µL supernatant liquid in clean 2 mL tube Clean-Up
- Add 7M NH4OAc to achieve final concentration of 2.5 M (approx 360 µl). Shake by hand to mix and spin at full speed (13,200 rpm) for 5 minutes.
- Transfer the supernatant (approx 650 µl) to a clean microfuge tube. Add 7M NH4OAc to achieve final concentration of 2.5 M (approx 360 µl). Shake by hand to mix and spin at full speed (13,200 rpm) for 5 minutes. This should produce a clear supernatant. The colour should be extracted from the sample into the lower organic phase with the SDS forming a thick gel-like interphase.
- Transfer the supernatant (approx 580 µl) to a new tube. Add 0.54 volumes (315 µl) of isopropanol and incubate at room temperature for 15 minutes. Spin at full speed (13,200 rpm) for 5 minutes.
- Carefully remove supernatant and wash pellet with 1 ml of 70% ethanol. Spin at full speed (13,200 rpm) for 5 minutes, remove supernatant and allow pellet to air dry (15-45 minutes).
- Resuspend DNA pellet in 100 µl of TE buffer overnight.
- Add an equal volume of phenol and vortex briefly. Spin for 3 minutes at max speed, Remove top (aqueous) layer and transfer to a new tube
- Place on ice for 2 minutes. The solution should turn cloudy. Re-spin for about a minute.
- Remove top (aqueous) layer to a new tube. Estimate volume by weighing, add 1/10 volume of 3M NaOAc and 2.75 Volumes of 100% Ethanol Leave on ice for 5 minutes.
- Spin max speed for 10 minutes, decant off the ethanol, and wash 3 times with cold 70% Ethanol Remove as much ethanol as possible (aspirate and spin). Air dry for 15 minutes.
- Resuspend in 100 µL TE
9.2.2 Plasmid amplification and purification
9.2.2.1 Concert Plasmid Preparation Protocol
Before starting: Make sure there is no precipitation in buffer G2, dissolve is necessary by warming to 37°C. Pre-chill Buffer G3 in fridge (4°C). Preheat an aliquot of TE to 65 - 70° C
- Pick a colony from a fresh plate, and inoculate 100mL of L broth in a 1L conical flask. Add 125 mL of ampicillin. Mix thoroughly. Incubate overnight at 37°C with shaking.
- The next day harvest the cells by centrifugation at 6000g at 4C for 15 minutes. Remove all traces of medium by inverting the open tube until all medium has drained.
- Resuspended the pellet in 1.2 mL of Cell suspension buffer (G1) and suspend the cells until homogenous (vortex).
- Add 1.2 mL of cell lysis solution (G2), mix gently Do not vortex and incubate at room temperature for 5 minutes max. Close the lid on buffer G2 promptly.
- Add 1.6 mL of Neutralisation buffer (G3) and immediately by inverting the tube 5 times. Do not vortex. Centrifuge the mixture at about 15 000 G for 10 min
- Place a spin column in a 15 mL Falcon. Load the supernatant from step 5 into a spin column. Centrifuge at 5000g for 1 minute in a swinging bucket rotor. Discard the flow-through.
- Place the spin column back into the 15 mL tube. Add 3 mL of wash buffer (G4) to the spin column. Centrifuge at 5000g for 5 minutes.
- Place the spin column in a fresh tube add 0.8 mL of warm TE buffer directly to the centre of the spin column. Incubate at room temperature for 1 min then centrifuge at 5000g for 2 minutes.
9.2.2.2 Large Scale Plasmid Preparation (Maniatis et al)
Plasmid amplification
- Inoculate 10 mL of LB medium containing ampicillin with a single bacteria colony. Incubate overnight at 37°C with vigorous shaking.
- The following morning, inoculate 25mL of LB medium in a 100mL flask containing ampicillin with 100µL of the overnight culture. Incubate at 37°C with vigorous shaking until the culture reaches late log phase (OD600 » 0.6).
- Inoculate 25mL of the late log culture into 500mL of LB medium pre-warmed to 37°C with ampicillin in a 2 litre flask. Incubate for exactly 2.5 hours at 37°C with vigorous shaking. The OD600 of the culture will be approximately 0.4.
- Add 2.5 mL of a solution of chloramphenicol (34 mg/mL in ethanol). The final concentration of chloramphenicol in the culture is 170 µg/mL.
- Incubate at 37°C with vigorous shaking for a further 12-16 hours.
Harvesting
- Harvest the cells by splitting the volume in to 2 250 mL centrifuge vials and centrifuge at 4000g for 10 minutes at 4°C. Discard the supernatant.
- Wash in 100 mL of ice-cold STE (0.1 M NaCl, 10 mM Tris [pH 7.8], and 1 mM EDTA).
Alkaline Lysis
- Resuspend each pellet in 5 mL of Solution I (containing lysozyme) [See end]
- Transfer to a 50 mL polycarbonate rotor tube, appropriate for the Sorvall SA-600 rotor. Incubate at room temperature for 5 minutes.
- Add 10 mL of Solution II to each tube [see end]. Invert the tubes several times, and then stand on ice for 10 minutes.
- Add 7.5 mL of an ice-cold solution of 5 M KOAc. Cover the tube with parafilm and mix the contents by inverting the tube sharply several times. Stand on ice for 10 minutes.
- Centrifuge in a Sorvall Superspeed RC-5B at 10500 rpm (» 16000g) for 30 minutes at 4°C. The cell DNA and proteins should form a tight pellet at the bottom of the tube.
- Transfer the supernatant into two new rotor tubes.
- Add 0.6 Volumes (»12 mL) of isopropanol to each tube. Mix well and stand at room temperature for 15 minutes
- Recover the DNA by centrifugation in the Sorvall rotor at 9500 rpm (» 13000g) for 30 minutes at room temperature.
- Discard the supernatant. Wash the pellet with 70% ethanol at room temperature. Discard as much ethanol as possible, and then let the pellet air dry for 15-45 minutes.
- Dissolve each pellet in 4 mL TE (pH 8.0)
Purification
- Split the 4 mL plasmid solution from above in to 10 microfuge tubes of 400 µL. Add 5 µL of RNase (1 mg/mL) and incubate at 37°C for 30 minutes.
- Add an equal volume of phenol and vortex briefly. Spin for 3 minutes at max speed, Remove top (aqueous) layer and transfer to a new tube
- Place on ice for 2 minutes. The solution should turn cloudy. Re-spin for about a minute.
- Remove top (aqueous) layer to a new tube. Estimate volume by weighing, add 1/10 volume of 3M NaOAc and 2.75 Volumes of 100% Ethanol Leave on ice for 5 minutes.
- Spin max speed for 10 minutes, decant off the ethanol, and wash 3 times with cold 70% Ethanol Remove as much ethanol as possible (aspirate and spin). Air dry for 15 minutes.
- Resuspend in 100 µL TE
Solutions
SOLUTION ONE: 50 mM glucose 25 mM Tris 10 mM EDTA Store at 4°C, Dissolve 5 mg/mL lysozyme before use SOLUTION TWO: 0.2 M NaOH 1% SDS
9.2.3 DNA Digestion
Metagenomic DNA is digested by the endonuclease Sau3A. Three dilutions of enzyme are used in the digestion. They are: 1:80, 1:160, and 1:320. Each incubation contains: 4µL DNA 2µL 10 ´ Buffer 5µL enzyme dilution 9µL mQ water Reactions are incubated at 37°C for 15 minutes. Then immediately placed on ice. 2µL of RNase (1mg/mL), and 4µL of loading dye (25% Ficol, 1% bromophenol blue) is added to each reaction. The total volume (26µL) of each incubation is then loaded into separate wells on a 0.8% agarose gel, with a TBE or TAE running buffer that has previously been cooled to 4°C. The gel is run long enough to separate the size markers, and the desired fragments cut out (4-6 kb). The same sized gel block is cut from the adjacent lane and the gel block of interest is slide sideways into empty lane. Running the gel current backwards for 20 minutes will compact the fragments into a smaller amount of gel and remove small contaminating fragments. The new smaller gel block is removed and the DNA extracted from it using the methods in the High Pure kit (Roche)
9.2.4 Ligation
Ligations were set up with the volumes in the table below. Ligations were incubated at 4°C overnight, and then frozen at -20°C
| Ligation | 1 | 2 | 3 | 4 | 5 |
|---|---|---|---|---|---|
| Linear plasmid | 5 | 5 | 5 | 5 | 5 |
| 4-6 kb DNA | 0 | 2 | 5 | 10 | 10 |
| Ligase buffer 10´ | 2 | 2 | 2 | 2 | 2 |
| T4 DNA ligase | 1 | 1 | 1 | 1 | 0 |
| mQ H2O | 12 | 10 | 7 | 2 | 3 |
9.2.5 Transformation
All transformations were performed as per the manufactures instructions, included with the competent cells. BL21-SI competent cells we plated on LBON (no salt) media. LBON AGAR: To one litre mQ water, add 10g tryptone, 15g bactoagar and 5g yeast extract. Stir to dissolve. Adjust the pH to 7.0 with NaOH. Autoclave, and cool to room temperature